What Delhi’s air pollution looked like during Diwali 2016: A fact file

With the SC ban on firecrackers in Delhi during Diwali, BOOM looks back at Diwali 2016. Air quality of Delhi had deteriorated with record high PM 2.5 levels

WrittenBy:Boom Live
Date:
Article image

India’s Supreme Court  passed an order on October 9, 2017 prohibiting the sale of firecrackers till the end of the Diwali season  (November 1) in Delhi and the National Capital Region (NCR).

The court said it wanted to observe the effect of a firecracker-free Diwali on pollution levels in the city. The apex court has refrained from relaxing its order despite being accused of being insensitive to sentiments of many Hindus and also despite appeals from the trader community.

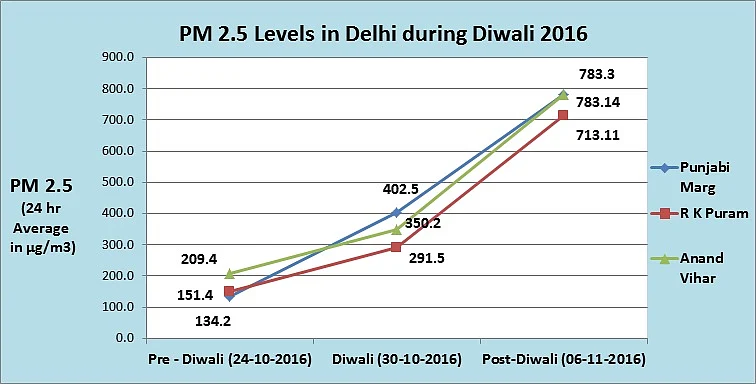
In 2016, post Diwali, the air quality of the national capital deteriorated severely and the city was covered with toxic smog. The Supreme Court stepped in imposing a ban on the sale of fire crackers in November 2016.

However, the court relaxed its order on September 12, 2017 only to be reversed on October 9th, days ahead of Diwali this year.

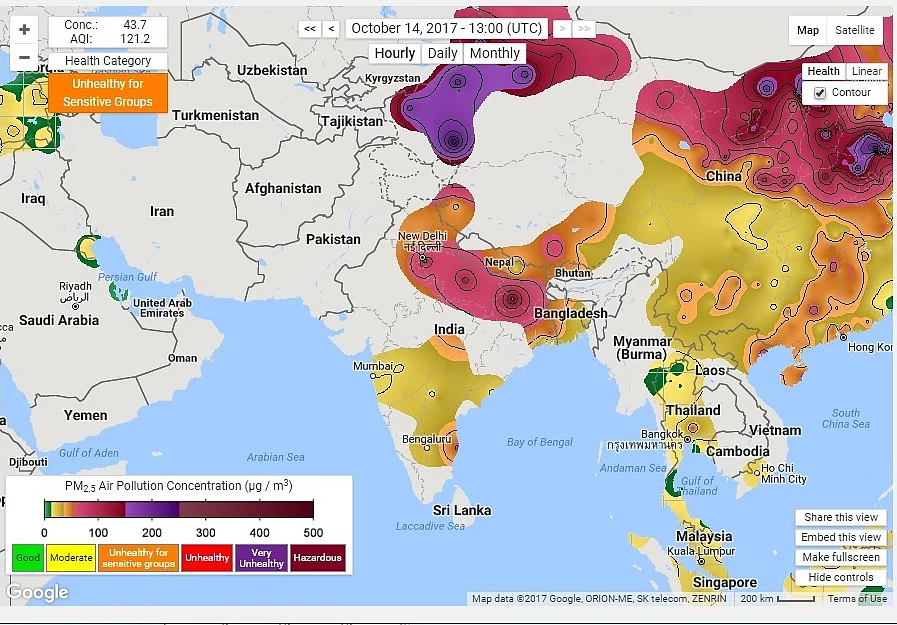
What happened to air quality in Delhi during the Diwali season in 2016

Air quality had deteriorated at an alarming rate as PM 2.5 levels hit record high in several parts of the city.

PM 2.5 areparticulate matter smaller than 2.5 micrometers found in the air. These microscopic solid particles and liquid droplets upon inhalation can penetrate deep into the respiratory tract and lungs increasing the risks cardiopulmonary diseases such as asthma, bronchitis and can even lead to a stroke.

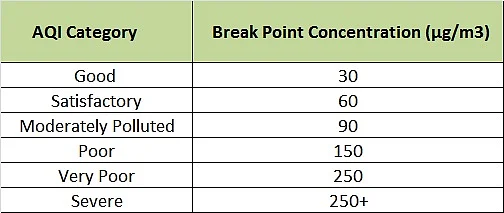
The prescribed standard for 24 hour average PM 2.5 level in the air is 60 μg/m3 as set by the Central Pollution Control Board (CPCB), India’s pollution watchdog. This is much higher than the 25 μg/m3 standard set by the World Health Organisation(μg/m3 refers to micrograms per cubic metre).

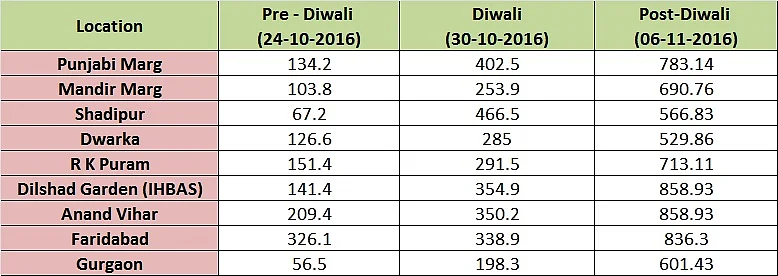
On the day of Diwali, PM 2.5 levels in Delhi had crossed severe levels. (see the definition of severe, below)

Air Quality Index (AQI) Category for PM 2.5 concentrations

subscription-appeal-image

Support Independent Media

The media must be free and fair, uninfluenced by corporate or state interests. That's why you, the public, need to pay to keep news free.

Contribute
imageby :

Source: CPCB

Here’s what air pollution looked like in eight locations across Delhi-NCR a week before Diwali, on Diwali day and a week after the festival in 2016.

PM 2.5 levels in 8 locations of Delhi – NCR (μg/m3 for 24 hours average)

imageby :

Source: CPCB

At Punjabi Marg in west Delhi, PM 2.5 level was already 2 times higher than the prescribed standard of 60 μg/m3. On Diwali day PM 2.5 level rose to 7 times the prescribed standard which soared to 13 times, a week after Diwali.

At R K Puram in south Delhi, PM 2.5 level was 2.5 times higher a week before Diwali,  5 times on Diwali and 12 times a week after Diwali – the prescribed standard.

At Anand Vihar in north Delhi, PM 2.5 level was 3 times higher a week before Diwali, it increased 6 times on Diwali and 14 times – the prescribed standard.

imageby :

Source: CPCB

How was Diwali 2016 different from Diwali 2015?

Pollution levels during Diwali was higher in 2016 than in 2015. As data from 3 locations – Punjabi Marg, R K Puram and Anand Vihar shows, PM 2.5 levels which were at comparable levels before the day of Diwali, soared in 2016 compared to 2015 post Diwali.

imageby :

Source: CPCB

 Day 1 to Day 14 in 2016 refer to Oct 24 to Nov 06. In 2015 it is Nov 05 to Nov 18.

imageby :

Source: CPCB

imageby :

Source: CPCB

While PM 2.5 concentration in the air subsided in 2015 post Diwali, it increased alarmingly to peak levels in 2016.

Why did this happen?

CPCB attributed it to unfavourable meteorological conditions.

Average wind speed on Diwali day 2016 was 1.3 metre per second while it was more than double (3.4 m/s) on Diwali day 2015.

In 2016, the mean mixing height on Diwali day was 492 meters and 152 meters on Diwali night. The corresponding numbers for 2015 were, 590 meters 324 meters.

Mixing height refers to the height to which suspended particles in the air rises leading to vertical mixing of the air. It depends on the atmospheric temperature. Higher the temperature, higher the mixing height and thus, higher dispersion of suspended pollutants.

With lower wind speed and mixing height in Diwali 2016, the pollutants remained suspended near the ground escalating the condition.

What is current pollution level in Delhi as compared to other metropolitan cities?

imageby :

Source: CPCB, Data of October 14, 2017

While Delhi – NCR has recorded PM 2.5 concentration between ‘moderately polluted’ to ‘poor’ levels, other metropolitan cities have recorded better air quality.

On October 14, 2017 Chennai (Location – Alandur) recorded PM 2.5 concentration of 47.08 μg/m3, Mumbai (Location Bandra) – 42.71 μg/m3 and Bangalore (Location – BTIM)  – 14.72 μg/m , all fall under the prescribed standard of 60 μg/m3.

Following is the real-time map of air pollution of October 14, 2017 as monitored by Berkeley Earth, an US organization that keeps track of climate change.

imageby :

This article has been re-published with the permission of BOOM. Visit the website here.

subscription-appeal-image

Power NL-TNM Election Fund

General elections are around the corner, and Newslaundry and The News Minute have ambitious plans together to focus on the issues that really matter to the voter. From political funding to battleground states, media coverage to 10 years of Modi, choose a project you would like to support and power our journalism.

Ground reportage is central to public interest journalism. Only readers like you can make it possible. Will you?

Support now

You may also like