The mystery of India’s ‘middle class’: What Financial Times and Marcellus didn’t tell you
Breaking down the flawed logic behind FT’s latest assertions on India’s middle class – from wildly clubbing Rs 5 lakh earners with crorepatis to ignoring how averages distort the truth.
Note: All numbers are in nominal terms not adjusted for inflation.
Imagine drowning in a river that’s “three feet deep on average” – a joke the Financial Times and Marcellus Investment Managers turned into economic gospel. Their viral claim of India’s “stagnant” middle class, citing a mere 0.4 percent annual income growth, collapses under scrutiny. Why? Their definition of “middle class” absurdly clubs Rs 40,000 per month earners with crorepatis, masking reality with statistical sleight-of-hand.
Averages, as the river analogy warns, obscure more than they reveal. While FT and Marcellus trumpet stagnant incomes, the income tax data they have used to make this claim, shows explosive growth in the number of individuals filing income tax returns.
Indeed, the number of individuals filing income tax returns in the Rs 5 lakh to Rs 1 crore annual income bracket – which is their definition of middle class – has ballooned from 55 lakh to 3.98 crore in a little over a decade.
But this isn’t a victory lap, it’s a paradox. Surging formalisation – more individuals filing income tax returns – coexists with a large part of the economy struggling, reflected in slow two-wheeler sales, shrinking household savings, a swelling agrarian workforce, more than 2,000 cash distribution programmes being run by different state governments and so on.
India’s story isn’t binary. Simplistic narratives – whether “stagnation” or “boom” – fail its complexity. The truth? Averages lie, growth is uneven, and the middle class is neither a monolith nor a headline.
So, what gives?
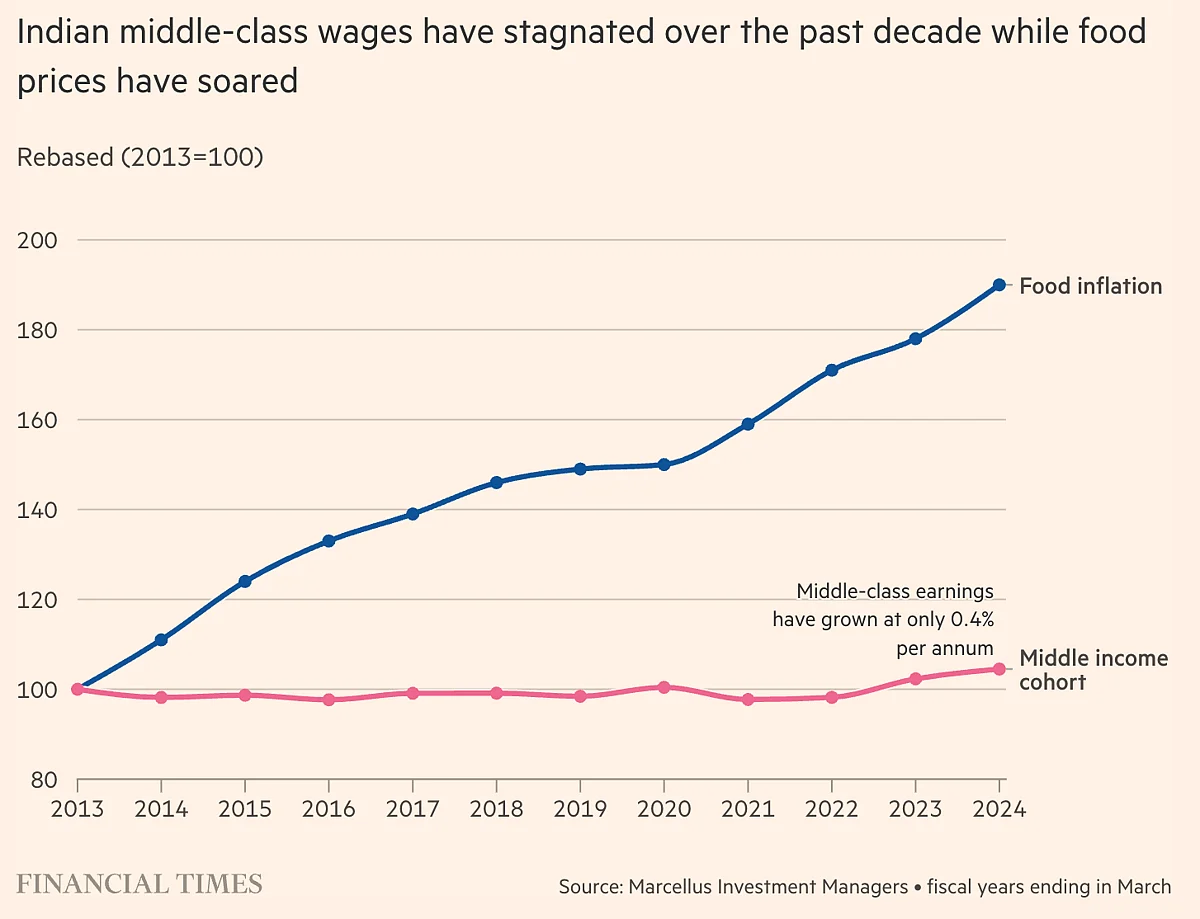
On May 13, Financial Times’s India Business Briefing published the following chart:

The chart tells us that the income of the Indian middle class has increased at only 0.4 percent per year from 2013 to 2024. This calculation was carried out by Marcellus Investment Managers, a portfolio management service. Its founder and chief investment officer, Saurabh Mukherjea, said during an interview last month that middle class incomes are “stagnant”.
Typically, the term ‘middle class’ is often used loosely, especially in the media, with little regard for a precise definition. It’s used to refer to a state of mind where people self-identify as middle class.
Now, people can believe what they want to, and there are social, political and economic impacts of that. But when we are talking about the country as a whole and making inferences, a proper definition needs to be in place.
And I don’t say this lightly. In more than two decades of being in this business of thinking and writing on the Indian economy, I have met enough people who have done very well in life, earned a lot of money, own more than one house, take regular foreign and domestic holidays, and so on – but still lament the fact that they are middle class because there are people out there who are richer than they are and doing better than they are.
I mean, there will always be people who will be better placed and more high-flying than you are. But, dear reader, that doesn’t necessarily make you middle class.
Now, let’s get back to Financial Times and the chart they used.
As mentioned earlier, this chart has been sourced from Marcellus Investment Managers. How did they define middle class?
Take a look at the following table published by Marcellus in a report titled India’s Middle Class is Losing Ground to the Rich & the Poor. The chart published by Financial Times is also a part of this report and has its heart in this table.

Let’s try and understand this table in a little more detail. Things might get slightly complicated here, but stay with me.
The flawed ‘middle class’ narrative
1) The Marcellus table uses data of individuals who file income tax returns. The years 2012-13 and 2023-24 in the above table aren’t financial years but assessment years (AY). What does this mean?
Subscribe now to unlock the story

Why should I pay for news?
Independent journalism is not possible until you pitch in. We have seen what happens in ad-funded models: Journalism takes a backseat and gets sacrificed at the altar of clicks and TRPs.
Stories like these cost perseverance, time, and resources. Subscribe now to power our journalism.
- Paywall stories on both Newslaundry and The News Minute
- Priority access to all meet ups and events, including The Media Rumble
- All subscriber-only interaction – NL Chatbox and monthly editorial call with the team
- Stronger together merch – Fridge magnets and laptop stickers on annual plan
₹ 500
Monthly₹ 4999
AnnualAlready a subscriber? Login
