‘Among informal workers, the less educated travel the farthest’
A new report reveals distinct patterns in migration corridors, including on where and how far informal workers are willing to go in search of work.

When the Covid-19 lockdowns stopped migrant workers in their tracks, with little money, work or means to go back home, governments of destination states struggled to figure out how many migrants they had, in order to provide free foodgrain, support and medical help.
India’s migrant workers are an amorphous group, scattered across several states, moving for a variety of push and pull factors. To understand the profile of the average migrant, researchers from Azim Premji University looked at different government databases, and found some interesting trends.
Informal workers with lower levels of education, especially from the eastern states, travel the farthest for work. Migration is largely distress-driven, but spatial variations show economic distress and traditional corridors can dictate where one travels to for work.
And finally, workers from states with lower per capita incomes—which also have higher fertility rates—move to richer states with low fertility rates, leading to what the authors call a rebalancing of India’s demographic dividend.
IndiaSpend spoke with Tamoghna Halder, co-author of the State of Working India report 2026. Halder has a PhD from the University of California, Davis and teaches economics at Azim Premji University.
Edited excerpts:
India's census counts migrants both within and across states. Given that the census is now 15 years old, what other datasets can we look at to understand the state of migrant workers across the country?
Currently in India, there are no official surveys that can present an accurate picture of migration at either intra or inter state level. The last official survey data on migration was collected through the Periodic Labour Force Survey (PLFS) 2020–21 and the Multiple Indicator Survey (2020–21). However, the data not only suffers from the lack of reliable insights on several variables, it also was carried out at a time of massive uncertainties posed by the pandemic, which inevitably caused patterns of migration that are far from the usual. Thus, we do not have any reliable data on migration at the moment.
The Ministry of Statistics and Programme Implementation has proposed to conduct a Survey on Migration during July 2026-June 2027. This also coincides with the census data collection timeline. What can we expect to see from these two sources?
If the data collected is accurate, we should be able to right away benchmark the census and the survey, although one may expect a difference in the timeline of release for these two datasets, with the latter expected to be released sooner.
It would be worthwhile to validate/update our general understanding of how migration works: In India, it is largely intra-state than inter-state; does that continue to be true? Migration for formal work opportunities will constitute a relatively lower share than informal work-related migration. While the Census would not distinguish between these two types of work arrangements, the survey would be helpful to shed light on the same.
Finally, it would be important to verify if the reasons for migration have shifted. As of 2011, the median migrant in India is not a man moving for work but a woman moving for marriage-related reasons. Whether that remains to be the case or work-related migration has taken over would be important to check.
Your report finds that young men are increasingly dropping out of education to earn—rising from 58 percent to 72 percent between 2017 and 2023. Do these workers show up in your eShram migration data, and if so, how do they compare to the more educated migrants you describe?
The data sources behind these two claims are distinct and hence we cannot ascertain for sure. However, this is one of the plausible reasons why we find that younger migrants are more educated than their older counterparts.
The other plausible explanation that we cannot rule out is that the younger generation of Indians are more educated than older ones, and relatedly, the job opportunities in home state have shrunk such that it cannot absorb the local educated youth to an extent that it could have a few decades back.
If you were to compare India's migration trends to other countries, what are the similarities and differences you observe?
We do not look at international migration statistics in the report so I can only comment from my general understanding. At a surface level there are similarities that one may observe. For example, Vietnam would experience a similar migration pattern of rural to urban, from agricultural to industrial jobs.
But what makes India distinct is perhaps the impact of networks, especially caste and village networks, in determining migration flows and patterns. Thus, even though migration patterns geographically may appear similar, the underlying structures driving it are different, with a strong desire to either break away or to remain within the caste networks that operate locally.
The report says that "for women, informality is not merely a transitional phase but a structural condition shaped by persistent constraints on occupational mobility”. What are the implications of this? And what other gendered patterns are visible?
The gendered patterns are somewhat obvious—women within the unorganized sector are more likely to be either in agricultural labour or work as domestic workers, and beauty-related services especially for younger women—all likely linked with migration along with the husband or the male head of household.
There is as such no implication of this in either policy or academic terms right away, but something for us to think about. For example, can we create socio-cultural and economic conditions, to enable a woman worker from say West Bengal, to migrate to Karnataka to work as a gig worker for an app-based food delivery aggregator? While this may or may not improve income levels necessarily, it would increase opportunities for women to participate in a wider set of unorganised sector jobs from which they are currently restricted for no reason whatsoever.
Can you take us through the methodology of your analysis?
We looked at data from the eShram portal, a government registry of over 300 million workers in the unorganised sector. Registration in e-Shram is voluntary, so we compared the state-wise shares of informal workers between eShram and the Periodic Labour Force Survey (PLFS). For most states, the two sources rank states similarly.
The pool of eShram workers shows roughly a similar age distribution as PLFS, except at the two extremes—below 25 and 40 and above. However, the subset of migrant workers in eShram capture an age distribution that is disproportionately young (See table below).
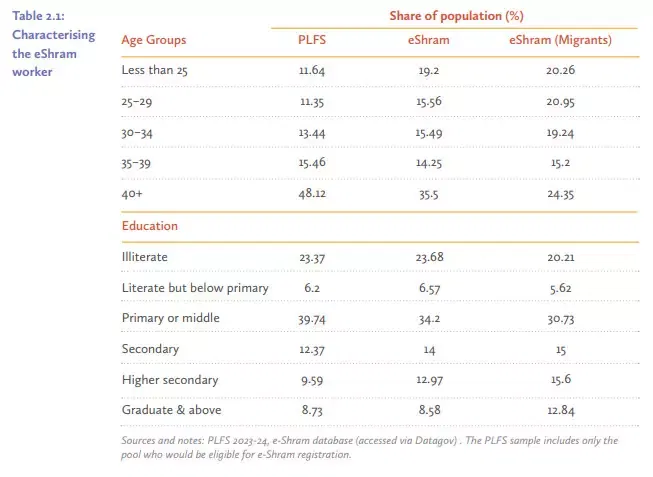
Workers below 25 account for 11.6 percent of the PLFS workforce but 20.3 percent of eShram migrants. The 25-29 age group tells a similar story, with only 11.4 percent in PLFS, but 21 percent among eShram migrants. At the other end, workers aged 40 and above make up nearly half (48.1 percent) of the PLFS workforce, but only 24.4 percent of eShram migrants.
In other words, unorganised sector migration, as per eShram, is disproportionately a young person's experience: Nearly two in five migrants are below the age of 30, compared to one in five in the overall unorganised workforce.
The education profile of migrants differ in a similar direction. Migrants with higher secondary qualifications account for 15.6 percent of eShram migrants, compared to 9.6 percent in PLFS and 13 percent among all eShram registrants. Graduate and above workers make up 12.8 percent of migrants, compared to 8.7 percent in PLFS.
The informal migrant, in other words, is not the lower educated older worker but increasingly, they are young and have relatively higher levels of education, reflecting a direct consequence of two decades of expanding educational enrolment across India.
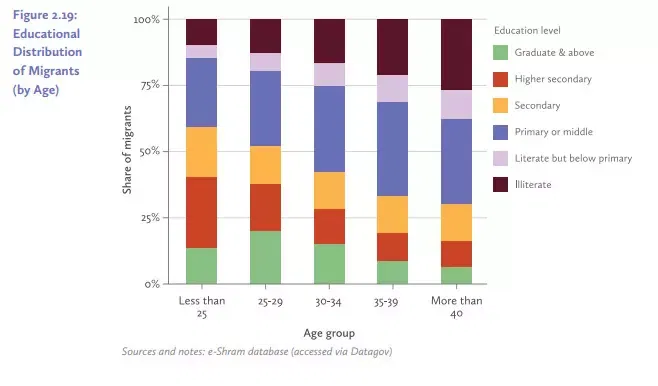
Among migrants aged 29 or below, the share of those with higher secondary or graduate qualifications is visibly larger than among those aged 40 and above, where illiteracy and below-primary education dominate. Younger migrants therefore are systematically more educated than older ones. (See chart below)
How does education affect migration decisions?
Data from India's eShram portal suggests that at least among unorganised sector migrants, it is the less educated who travel the farthest. The more educated tend to stay closer to home.
The maps below are built around a metric that captures how far migrants travel, conditional on their level of education. For every destination district in India, the report identifies which zone the majority of its unorganised sector migrants come from—but only if that majority is clear, meaning more than 50 percent of migrants in the district originate from a single zone. If no single zone accounts for more than half, the district is classified as mixed and left uncoloured. What the maps show, then, is not the full flow of migration across India, but rather the districts where one origin zone is dominant.
Each colour represents a zone: black for the East (Bihar, Jharkhand, Odisha, and West Bengal), red for the North, blue for the South, and so on. The two maps present this picture separately for two extremes of the educational distribution—one for the least educated migrants (illiterate and below primary), and one for those with graduate education and above.
The contrast between the two maps presents the distance paradox. Eastern zone migrants with lower education levels are travelling long distances, crossing zonal boundaries, and showing up as the dominant source of workers in districts far removed from their origin states. Northern migrants stay more contained within the northern belt; southern migrants largely dominate southern destinations. But the East stands out for the sheer geographic reach of its low-educated migrant streams.
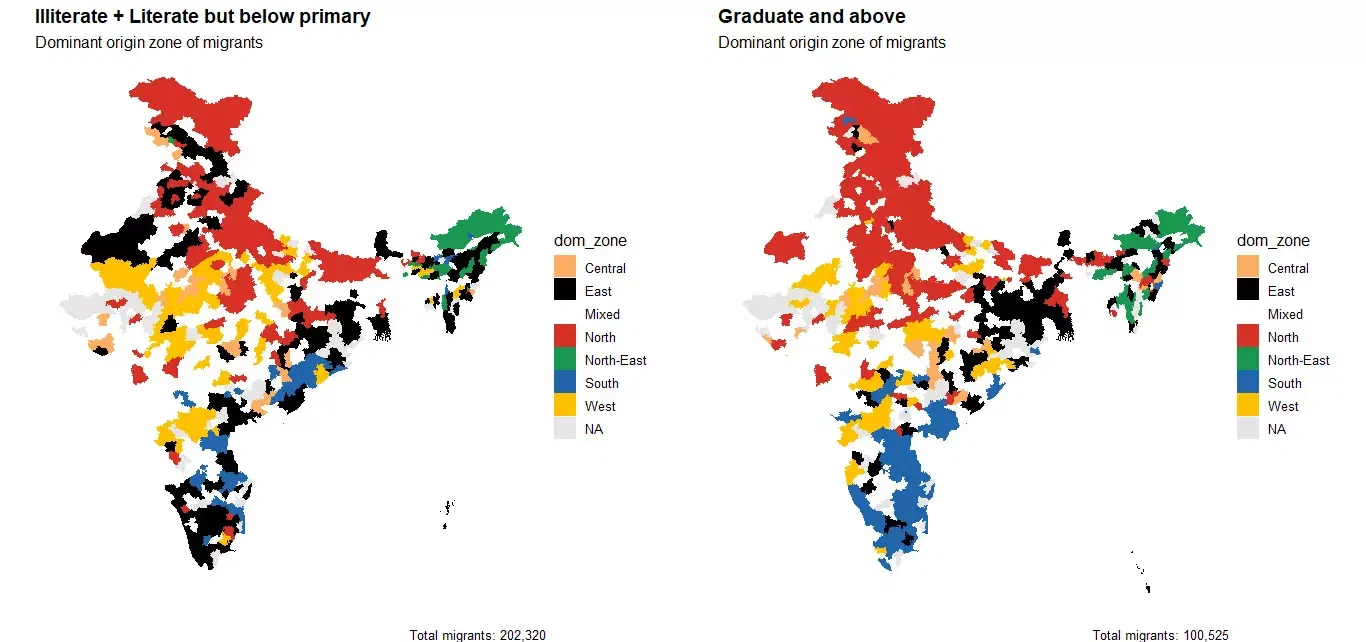
The right-hand map, covering graduate and above migrants, tells an almost opposite story. The colours become more spatially contained. Eastern-origin dominance reduces sharply, to a much smaller set of districts. In fact, when compared to the left-hand map, the right hand map shows that destination zones cluster closer to origin zones, that is, northern migrants dominate northern destinations, southern migrants dominate southern ones and so on. Higher-educated unorganised sector migrants, regardless of where they come from, do not travel as far as their peers with lower education.
What explains these patterns?
Higher education is often perceived as a factor that enables a worker to expand their radius of job search, as more opportunities open up if the worker is willing and able to travel. For example, an engineer from Gorakhpur or Kolkata, can secure a white collar job in one of the glittering IT parks in Gurgaon, Bengaluru, Hyderabad, Pune or Chennai. This is especially true when the local economy of the origin state fails to create enough jobs that meet the aspirations of a highly educated workforce.
Such a perception, however, may be limited only to the formal sector jobs—which in itself accounts for a small share of the workforce. For example, securing a job in these far away destinations, whether white collar or blue collar, may not be straightforward or even possible for an ITI trained plumber from Gorakhpur or Kolkata.
Several mechanisms could plausibly account for this pattern. Educated informal migrants may be more likely to treat their current jobs as transitional and staying close to home while actively searching for better formal opportunities nearby. Regional language, cultural ties, and social networks may also anchor lower educated workers more firmly to distant yet familiar labour markets, especially as they are also likely to be older—they may be relying on familiar networks that help with some form of social safety nets at the destination, even if the destination is far away. Less-educated migrants may also have greater economic compulsion and fewer reasons to stay within a familiar region, they follow work wherever it appears—even across long distances.
You identify three distinct migration channels. Can you walk us through them?
The report examines state-level migration patterns alongside indicators of state-level economic development such as per capita Net State Domestic Product (NSDP). States with lower per capita income tend to send out substantially larger numbers of informal migrant workers, while richer states exhibit much higher levels of net in-migration. In other words, the direction of migration depends on a state’s economic position to a great extent.
However, economic development is not the unique pull factor for migration in the unorganised sector. Examining the largest net-sending states (UP, Bihar, Jharkhand, Madhya Pradesh, West Bengal, and Assam) helps one identify three distinct migration channels, each shaped by a different combination of economic pressure, social networks, and geography.
The first is distress-driven, long-distance migration, most clearly associated with UP and Bihar. Migrants from these two states dominate destination districts across large parts of the country. In certain districts of Maharashtra and Delhi NCR, more than 40 percent of all unorganised sector migrants originate from UP alone. Migrants from Bihar are also spread across India, in fact, at a higher rate than migrants from UP.
This migration is driven less by specific opportunities in destination states and more by the sheer pressure of large, young populations and limited local job creation. The report describes it as functioning as a systemic outlet for demographic pressure—workers pushed outward by the absence of viable options at home, rather than pulled by specific opportunities elsewhere.
The second channel combines economic distress with established migration networks, most visible in Jharkhand and West Bengal. Both states are well below the median Indian states in terms of NSDP per capita, but their migrants move along more specific and historically rooted corridors. Migrants from Jharkhand tend to move northward; those from West Bengal are more likely to travel southward, with a notable concentration in districts across Kerala. These routes reflect long-standing social networks that channel workers toward particular destinations even under conditions of general distress—networks that have, over time, built the infrastructure of information, contacts, and trust that make certain destinations more accessible than others.
The third channel is characterised by spatial containment, most visible in Assam and Madhya Pradesh. Despite both states being low performers on per capita income, their migrants largely stay within proximate regions. Assam's migration is largely self-contained within the northeast. MP's dominance is concentrated within the central zone and immediately neighbouring districts. Here, proximity, linguistic and cultural specificity, and regional labour market ties appear to constrain the geographic reach of migration even when the economic pressure pushes workers to leave. Unlike the first channel, where distress produces wide dispersal, here distress produces only short-distance movement.
What are the implications of these findings, for policy and planning?
These migration flows reflect something larger about how India's workforce is being shaped. States that are net receivers of unorganised sector migrants, whether in the north or south, tend to be ageing states with higher median ages and tighter labour supply. States that are the largest net senders – UP, Bihar, Jharkhand, Assam, Odisha – are at the younger end of India's demographic distribution, and consistently rank lower in economic performance.
Informal migration is thus functioning as one of the primary channels through which surplus labour from younger states is absorbed by older, more economically dynamic ones. The demographic dividend therefore, in part, is being spatially rebalanced through the movement of informal workers.
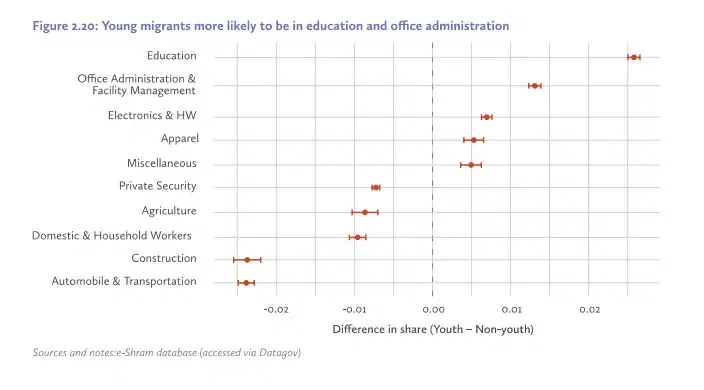
But the data also reveal a more nuanced understanding of this rebalancing. Younger cohorts entering the unorganised migrant workforce are more educated, a direct impact of two decades of educational expansion. In fact, the report notes how younger workers, mostly on account of higher levels of education, are more likely to find informal jobs in sectors such as education, office administration, electronics and hardware, healthcare etc., while older and less educated workers are more prevalent in construction, agriculture, leather industry work, and domestic services. This shows that even if modest, higher levels of education helps workers find jobs in sectors that are more modern in nature, and more white-collarish within the blue-collar world of India’s unorganized sector.
Thus, as India moves through the remaining years of its demographic-dividend window, policymakers have a decision to make—how to best accommodate the aspirations of an increasingly educated and young workforce, whose aspirations for finding formal sector employment ties them closer to home? Does the answer lie in creating more formal jobs locally? Or, should one focus on creating more jobs in the modern services within the informal economy itself, while subsequently strengthening social protection schemes for these unorganised sector workers?
This report is republished with permission from IndiaSpend, a data-driven, public-interest journalism non-profit. It has been lightly edited for style and clarity.
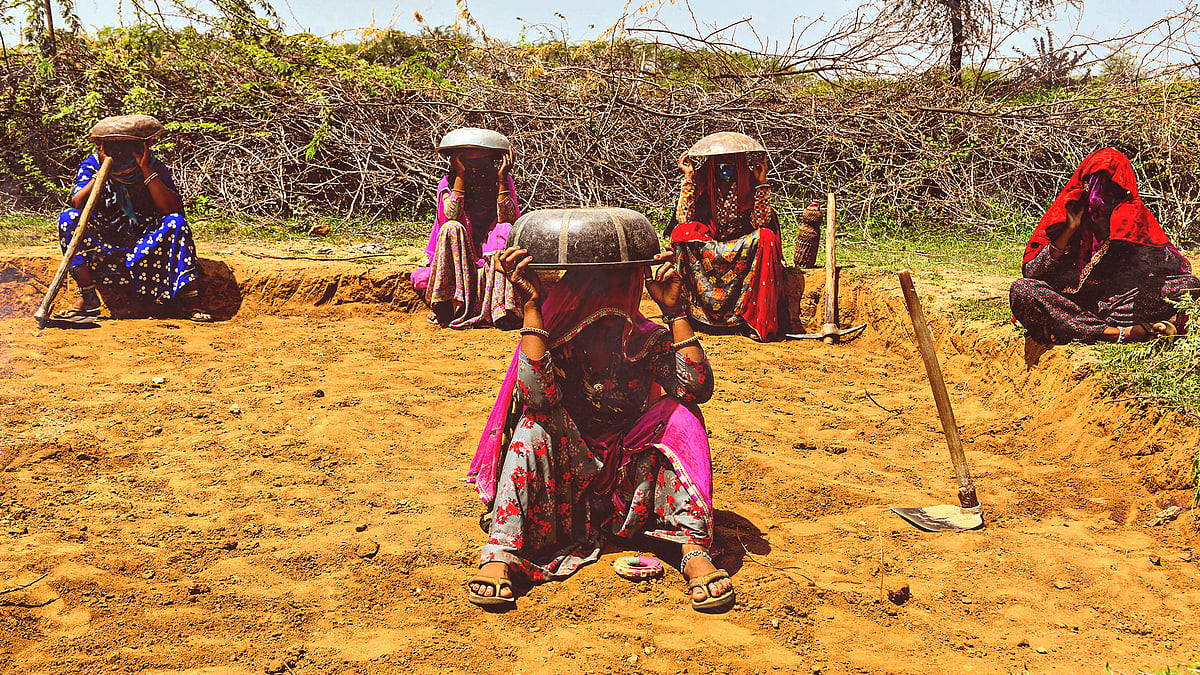 Extreme heat is quietly pushing women out of work
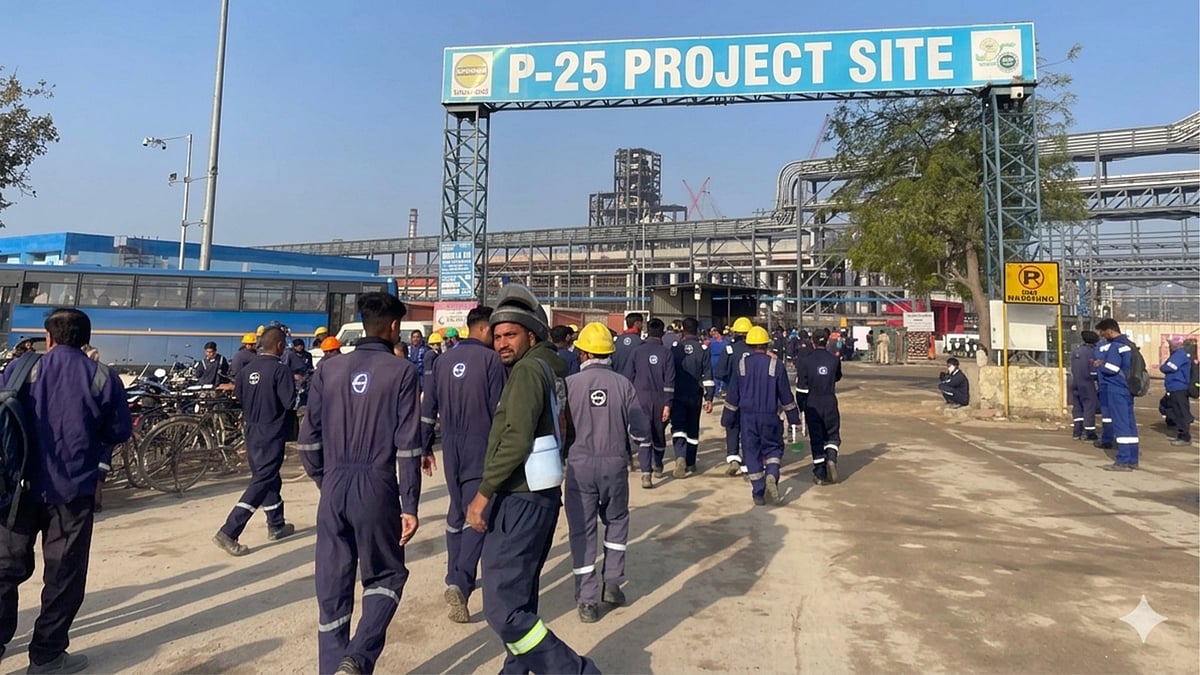 The anatomy of a protest: Why workers across refineries in India are striking work?